Customer Testimonial


End User Experience
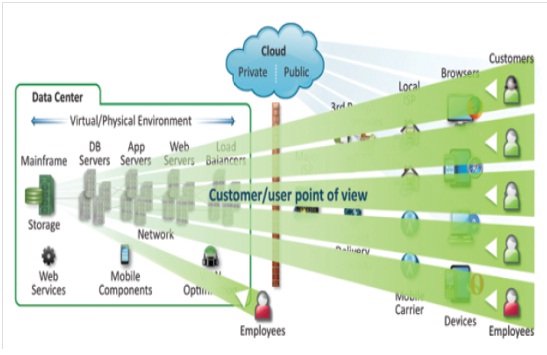
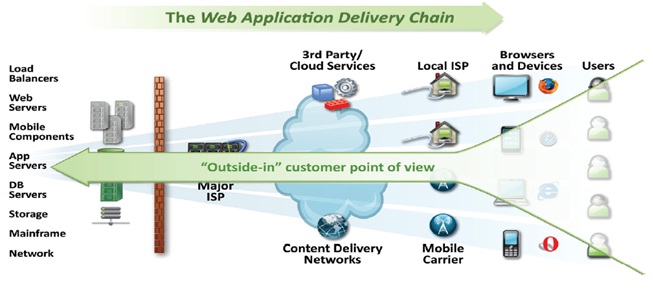
Users access applications via intricate chain - starting with an array of mobile devices, browsers traversing the internet, mobile to corporate WAN. The most important aspect of performance management is in the eyes of the end user.
The end user experience Analytics, offers an “Outside-in” approach, from an end user perspective, providing a complete picture of the application performance across the delivery cycle.
The end user experience analytics enables business to test & monitor
- What the end-users and the customers are doing (key transactions and pages)
- From where are they doing it from (different geographic zones and various time zones?)
- How are they doing it (key clients, browsers, operating systems, and mobile devices?)
- When do they do it (normal and peak usage?)
By measuring end users experience, you can determine how many users are affected by a problem and how the issue is critical to business.
Highlights
| Title | Description |
|---|---|
| Gartner Magic Quadrant | Service built with Compuware Gomez - a Leader in the Gartner Magic Quadrant for application performance monitoring |
| Analytics - Production Environment | Detailed diagnostics on your Production environment, providing a instant view on business. Provides analytics on the severity of each individual issue, which enables to understand, how critical the issue is to business. |
| Sample Reports |
End-User Reporting - Detailed Reporting of end users & customers covering - what they do, When they are doing it, How do they do it & when they do it. Drill-Down Reporting - Deep dive drill down reporting across different components, enabling by isolating the root cause and fix issues quickly. Performance Reporting: Performance reporting covering the usage reporting , performance reporting and availability statistics |
| Infrastructure – Diagnostics | Monthly analysis reports correlating infrastructure performance with application performance |
| Business Dashboard | Real-time dashboard provides reporting on the application performance, infrastructure analytics (if subscribed) along with business KPI’s, resulting in a unified view of the business service management |
| Internet Trafic | Provides application performance monitoring of Http or Https traffic on the website. |
| Performance Charts | Performance charts providing information on the Performance Trends- network Charts, Availability Trends, User Trends, Distribution Trends |
| Infrastructure Correlation | Monthly Infrastructure analysis reports correlating infrastructure performance with application performance |
| Advanced Diagnostics | Analytics on the”. Java” & “.net” components across applications, servers, databases, providing a component level fault Isolation |
| Alerts & Notifications | Alerts & Notifications if the Application Performance goes below the Threshold Values |
Plans & Packages
Sify's End User Experience Analytics service is offered for Monitoring Http, Https traffic from an end user perspective as well as The Various Plans are as below
The above plans can be subscribed for the customers, deploying their setup on Sify's InfinitCloud setup or collocated at Sify DC's Airoli and Bangalore DC. The above plans are available on the basis of number of URL's required to be monitored.
| Sr No | Plan | Deliverables |
|---|---|---|
| 1 | Deep Dive analytics | Provides real time online Http or Https Performance reporting and deep dive analytics |
| 2 | Performance Charts | Provides real time online trends for Http or Https Traffic across Performance, Network, users, distribution & Availability |
| 3 | Business Dashboard | Provides real time Dashboard with Application Performance & infrastructure Analytics along with the business KPI's resulting in a unified business service view |
| 4 | Advanced Monitoring | Provides real time online Analytics on ".Java" & ".net" components, resulting in Component level optimization |
To know more about the prices, please click on “Have us call you” or email us at connect@cloudinfinit.com.
Resources
Compuware Gomez – Leader in Gartner Magic Quadrant.
http://www.gartner.com/technology/reprints.do?id=1-17D6C7I&ct=110920&st=sg
Compuware Gomez – End User Experience Analytics.
Detailed Descriptions
Sify's End User Experience Analytic, provides a unified look at application performance from the perspective of the end-user.
- Visibility: see the true service quality being delivered to the end user
- Prioritization: prioritize incident/problem resolution events with quantified business impact information
- Isolation: immediately isolate which technology group is accountable for the incident or problem
- Resolution: quickly find and fix the root cause of the problem through in-depth analysis
- Communication: improve IT and business communication using business relevant information
- Improvement: continually improve service quality using best practices such as ITIL and automated Six Sigma techniques
To explore more on plan & packages for subscription or for trial of services – Login to cloudinfinit portal now


- Virtual Private Servers
- Virtual Private Instances
- Managed Dedicated Servers
- Virtual Private Instances HADR
- SAN
- NAS
- 2SiteStore
- Router
- Server Load Balancer
- SSL Offload
- Global Load Balancer
cloudinfinit
InfinitCompute
InfinitStorage
InfinitNetwork
- Firewall
- DDoS
- FortKnox
- Server Health Monitoring
- OS / DB /APP Monitoring
- End User Experience
- Data Backup & Restore
- Remote DataProtect
- Disaster recovery as a Service
InfinitSecurity
InfinitAnalytics
InfinitProtect
Private Cloud
Hybrid Cloud
vCloud Powered Service
- Windows - All
- Linux
- Ubuntu and Others
- MS SQL
- MySql
- JBoss
- Sharepoint
- Value Added Services
Operating Systems
Data Bases
Middle Ware
Desktop as a Service
Software as a service
Messaging
PSAS
-
- .......................................................................................................
- Copyright ©2012.sifycorp.com.All rights reserved.
-